These US dog ownership statistics highlight the latest widely cited figures on how many American households own dogs, how the dog population has changed over time, how often dog owners use veterinary care, and how dog ownership behavior is evolving.
US dog ownership statistics
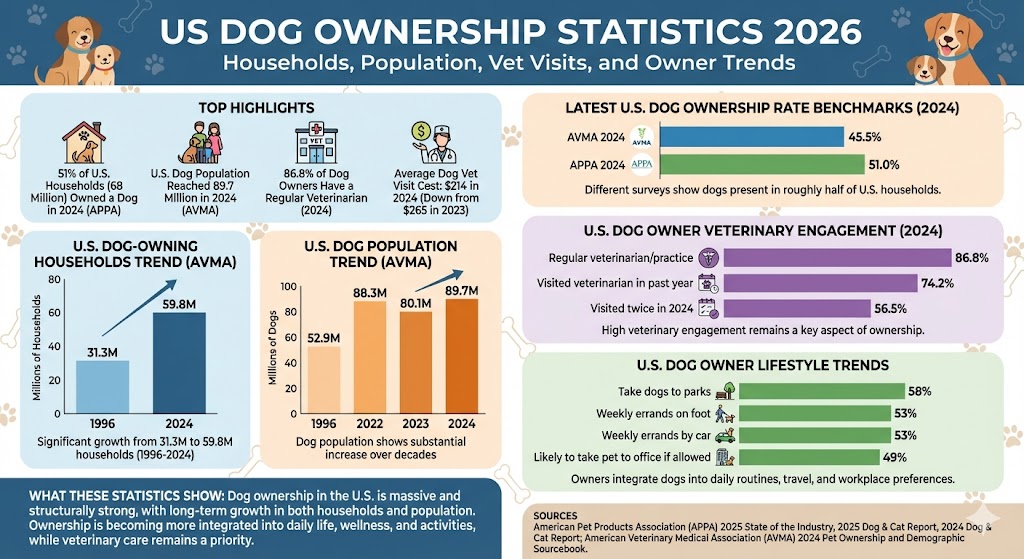
US dog ownership statistics (Top Highlights)
APPA says 51% of U.S. households, or 68 million households, owned a dog in 2024.
AVMA estimated 59.8 million U.S. households owned dogs in 2024, up from 31.3 million in 1996.
According to AVMA, dog-owning households represented 45.5% of all U.S. households in 2024, versus 31.6% in 1996.
AVMA estimated the U.S. dog population reached 89.7 million in 2024.
86.8% of dog owners said they had a regular veterinarian or veterinary practice in 2024.
74.2% of dog owners said they visited a veterinarian in the past year.
The average dog veterinary visit cost was $214 in 2024, down from $265 in 2023.
58% of dog owners said they take their dogs to parks.
53% of dog owners give their dogs vitamins or supplements.
49% of dog owners said they would be somewhat or very likely to take their pet to the office if permitted.
Different organizations use different survey designs, so the most useful way to read these figures is as current benchmarks rather than as a single interchangeable series.
Label
Bar
Value
AVMA 2024
45.5%
APPA 2024
51.0%
Max = 51.0%. Widths: AVMA 2024 89.22%, APPA 2024 100.00%
U.S. dog owner veterinary engagement
Label
Bar
Value
Regular veterinarian/practice
86.8%
Visited veterinarian in past year
74.2%
Visited twice in 2024
56.5%
Max = 86.8%. Widths: Regular veterinarian/practice 100.00%, Visited veterinarian in past year 85.48%, Visited twice in 2024 65.09%
U.S. dog owner lifestyle trends
Label
Bar
Value
Take dogs to parks
58%
Weekly errands on foot
53%
Weekly errands by car
53%
Likely to take pet to office if allowed
49%
Max = 58%. Widths: Take dogs to parks 100.00%, Weekly errands on foot 91.38%, Weekly errands by car 91.38%, Likely to take pet to office if allowed 84.48%
What these U.S. dog ownership statistics show
Dog ownership in the United States remains massive and structurally strong. Both APPA and AVMA show that dogs are present in roughly half of American households, while AVMA’s long-term data shows the number of dog-owning households and the dog population are far higher than they were in the mid-1990s.
The newest data also points to a more integrated form of dog ownership. Owners are more likely to build daily routines, travel, wellness spending, and even workplace preferences around their dogs, while veterinary engagement remains high across the category.
Sources
American Pet Products Association, 2025 State of the Industry Report release, March 2025
American Pet Products Association, 2025 Dog & Cat Report release, June 2025
American Pet Products Association, 2024 Dog & Cat Report release, August 2024
American Veterinary Medical Association, 2024 Pet Ownership and Demographic Sourcebook summary, December 2024
Browse through our top 10 cat travel bowls that ensure your furry companion stays fed and hydrated on adventures, but which one will suit your kitty best?
Keep your home stylish and tidy with these 10 pet nightstands that cleverly conceal litter boxes—discover the perfect blend of design and functionality!
Find the perfect smart pet water dispenser to keep your furry friend hydrated and discover features that could revolutionize their drinking experience.