These pet industry statistics show the latest available benchmarks on U.S. market size, category spending, household ownership, global market growth, and pet insurance expansion.
pet industry statistics
Pet Industry Statistics (Top Highlights)
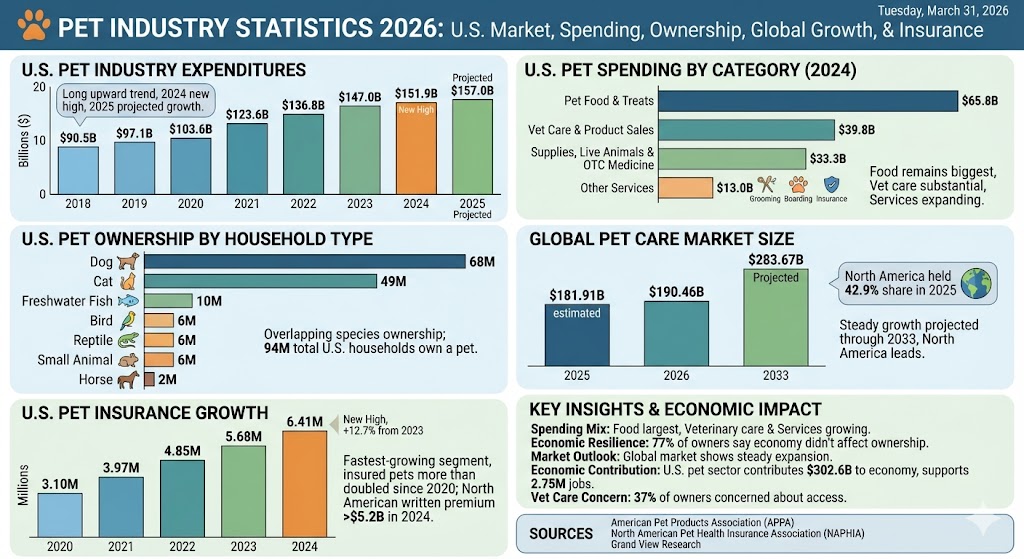
The U.S. pet industry generated $151.9 billion in 2024 and APPA projects $157 billion in 2025.
Pet Food & Treats was the largest U.S. category in 2024 at $65.8 billion.
Vet Care & Product Sales reached $39.8 billion in 2024.
Supplies, Live Animals & OTC Medicine totaled $33.3 billion in 2024.
Other Services, including grooming, boarding, training, insurance, pet sitting, and walking, reached $13.0 billion in 2024.
APPA says 94 million U.S. households own at least one pet.
Dogs are present in 68 million U.S. households, while cats are in 49 million.
Freshwater fish are in 10 million U.S. households.
Seventy-seven percent of U.S. pet owners said the economy had not affected their pet ownership.
Thirty-seven percent of U.S. pet owners said they were concerned about access to veterinary care.
The U.S. pet sector contributes $302.6 billion directly and indirectly to the economy and supports 2.75 million jobs nationwide.
The global pet care market was estimated at $181.91 billion in 2025 and is projected to reach $283.67 billion by 2033.
North America held a 42.9% share of the global pet care market in 2025.
North American pet insurance exceeded $5.2 billion in written premium at year-end 2024.
The U.S. had 6,405,541 insured pets in 2024, up 12.7% from 2023.
APPA’s public data shows a long upward spending trend, with 2024 setting a new high and 2025 projected to extend that growth.
U.S. Pet Spending by Category
Label
Bar
Value
Pet Food & Treats
$65.8B
Vet Care & Product Sales
$39.8B
Supplies, Live Animals & OTC Medicine
$33.3B
Other Services
$13.0B
Max = $65.8B. Widths: Pet Food & Treats 100.00%, Vet Care & Product Sales 60.49%, Supplies, Live Animals & OTC Medicine 50.61%, Other Services 19.76%
Food remains the industry’s biggest revenue pool, but veterinary spending is also large enough to show how much of the market is shifting toward health and ongoing care.
U.S. Pet Ownership by Household Type
Label
Bar
Value
Dog
68M households
Cat
49M households
Freshwater Fish
10M households
Bird
6M households
Reptile
6M households
Small Animal
6M households
Horse
2M households
Max = 68M households. Widths: Dog 100.00%, Cat 72.06%, Freshwater Fish 14.71%, Bird 8.82%, Reptile 8.82%, Small Animal 8.82%, Horse 2.94%
These household counts are species-level ownership figures, so they overlap because many homes own more than one type of pet.
Grand View Research estimates steady mid-single-digit growth for the global pet care market, with North America holding the largest regional share in 2025.
NAPHIA’s data shows that pet insurance remains one of the fastest-growing pockets of the broader pet economy, with U.S. insured pets more than doubling since 2020.
What These Pet Industry Statistics Show
The pet industry is still expanding, but the mix of spending makes the story more interesting than simple top-line growth. Food remains the largest category, veterinary care is taking a bigger share of consumer budgets, and service categories keep expanding as owners spend more on convenience and ongoing care.
The broader market also looks more durable than many discretionary categories. APPA says most pet owners have not changed ownership because of the economy, while NAPHIA’s data shows insurance penetration and premium volume still climbing. Globally, the market outlook also points to steady expansion through 2033.
Sources
American Pet Products Association, Industry Trends & Stats, accessed March 31, 2026
American Pet Products Association, 2025 State of the Industry Report release, March 26, 2025
American Pet Products Association, U.S. Economic Impact of the Pet Industry
North American Pet Health Insurance Association, State of the Industry Report 2025 and Total Pets Insured data
Grand View Research, Pet Care Market Size, Share & Growth Report 2033