These pet care market statistics highlight the latest available figures on U.S. pet industry spending, household ownership, category mix, global market size, and pet care e-commerce growth.
pet care market statistics
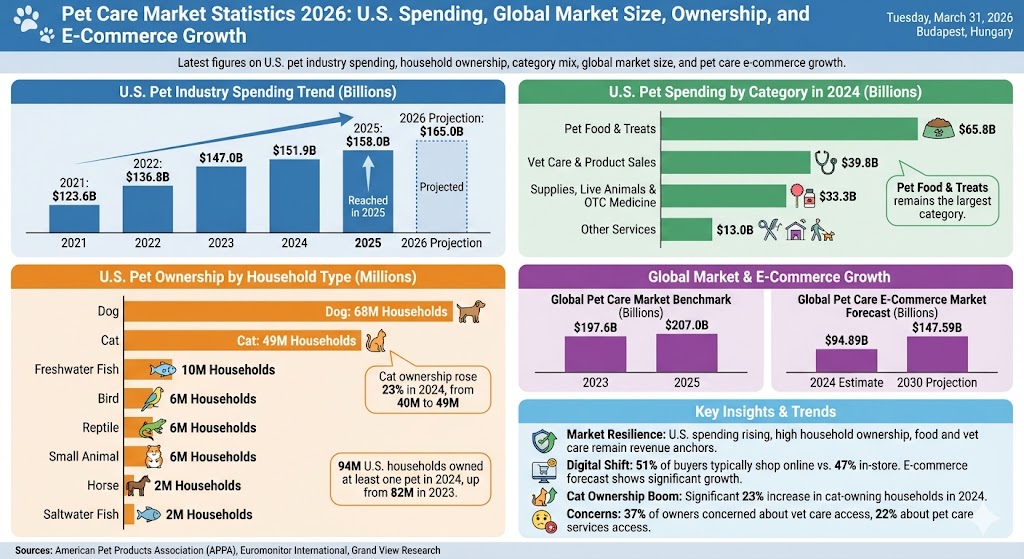
Pet Care Market Statistics 2026 (Top Highlights)
The U.S. pet industry reached $158 billion in spending in 2025, and APPA says it is projected to reach $165 billion in 2026.
U.S. pet spending was $151.9 billion in 2024, up from $147.0 billion in 2023 and $123.6 billion in 2021.
In 2024, pet food and treats made up the largest U.S. spending category at $65.8 billion.
Veterinary care and product sales reached $39.8 billion in 2024.
Supplies, live animals, and OTC medicine accounted for $33.3 billion in 2024.
Other services such as grooming, boarding, insurance, training, pet sitting, and walking added another $13.0 billion in 2024.
Ninety-four million U.S. households owned at least one pet in 2024, up from 82 million in 2023.
Dog ownership reached 68 million U.S. households in 2024, while cat ownership reached 49 million.
APPA’s 2025 Dog & Cat Report says cat ownership rose 23% in 2024, increasing from 40 million to 49 million households.
Fifty-one percent of buyers typically shop for pet products online, compared with 47% who typically shop in-store.
Thirty-seven percent of U.S. pet owners say they are concerned about access to veterinary care, and 22% say they are concerned about access to pet care services.
Euromonitor put the global pet care market at $197.6 billion in 2023 and $207 billion in 2025.
Grand View Research estimated the global pet care e-commerce market at $94.89 billion in 2024 and projects it will reach $147.59 billion by 2030.
Max = $65.8B. Widths: Pet Food & Treats 100.00%, Vet Care & Product Sales 60.49%, Supplies, Live Animals & OTC Medicine 50.61%, Other Services 19.76%
U.S. Pet Ownership by Household Type
Label
Bar
Value
Dog
68M households
Cat
49M households
Freshwater Fish
10M households
Bird
6M households
Reptile
6M households
Small Animal
6M households
Horse
2M households
Saltwater Fish
2M households
Max = 68M households. Widths: Dog 100.00%, Cat 72.06%, Freshwater Fish 14.71%, Bird 8.82%, Reptile 8.82%, Small Animal 8.82%, Horse 2.94%, Saltwater Fish 2.94%
Global Pet Care Market Benchmark
Label
Bar
Value
2023
$197.6B
2025
$207.0B
Max = $207.0B. Widths: 2023 95.46%, 2025 100.00%
Global Pet Care E-Commerce Market Forecast
Label
Bar
Value
2024 estimate
$94.89B
2030 projection
$147.59B
Max = $147.59B. Widths: 2024 estimate 64.29%, 2030 projection 100.00%
What These Pet Care Market Statistics Show
The pet care market remains one of the more resilient consumer sectors. U.S. spending continues to rise, household ownership is still very high, and food, veterinary care, and recurring services remain the biggest revenue anchors.
The market is also becoming more digital and more premium. Online shopping now plays a central role in pet product purchases, cat ownership is expanding quickly, and e-commerce forecasts suggest that a growing share of future pet care spending will move through digital channels.
Sources
American Pet Products Association, Industry Trends & Stats
American Pet Products Association, U.S. Pet Industry Reaches $158 Billion in 2025, Poised for Continued Growth in 2026
American Pet Products Association, 2025 State of the Industry Report press release
American Pet Products Association, 2025 Dog & Cat Report press release
Euromonitor International, September 2024 pet care sales press release
Euromonitor International, November 2025 pet care market press release
Grand View Research, Pet Care E-Commerce Market Size and Share Report
Check out the 10 best portable water bottles for dogs that will keep your furry friend hydrated on walks—discover which one suits your adventures best!
Stylishly save space with the top 10 wall-mounted pet bowls that elevate your pet's dining experience—discover which designs will enhance your home today!