These Chewy statistics highlight the latest official figures on revenue, active customers, Autoship penetration, customer spending, profitability, and platform scale. The most recent full-year numbers are for fiscal 2025, which ended February 1, 2026.
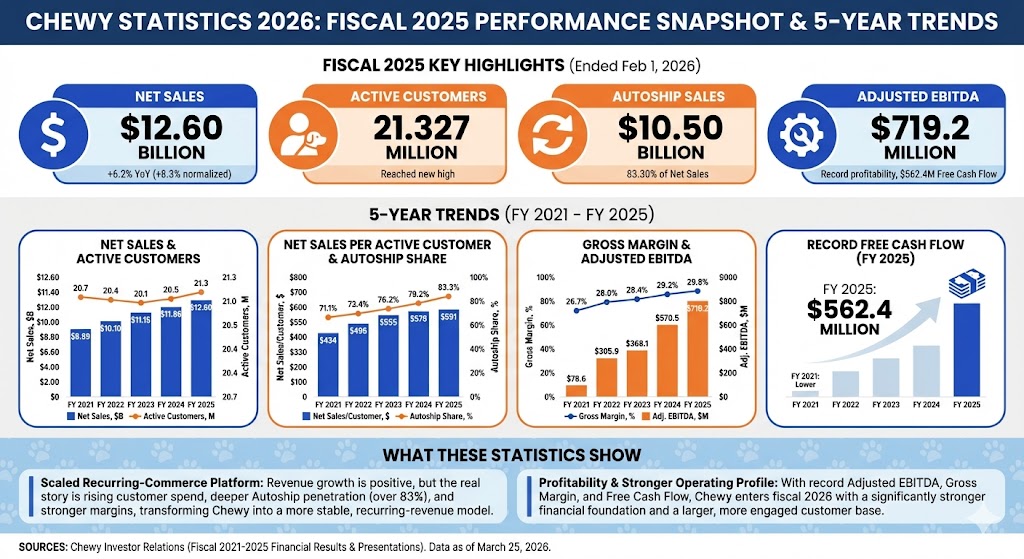
Chewy continued to grow in fiscal 2025, reaching $12.60 billion in net sales, 21.327 million active customers, $591 in net sales per active customer, and $10.50 billion in Autoship customer sales. The company also reported a 29.8% gross margin, $719.2 million in adjusted EBITDA, and record free cash flow of $562.4 million.
Chewy statistics
Chewy statistics 2026 (Top Highlights)
Chewy generated $12.60 billion in net sales in fiscal 2025.
Fiscal 2025 net sales increased 6.2% year over year, or 8.3% on a normalized 52-week basis.
Chewy ended fiscal 2025 with 21.327 million active customers.
Net sales per active customer rose to $591 in fiscal 2025.
Autoship customer sales reached $10.50 billion in fiscal 2025.
Autoship represented 83.30% of Chewy net sales in fiscal 2025, up from 71.14% in fiscal 2021.
Gross margin improved from 26.7% in fiscal 2021 to 29.8% in fiscal 2025.
Adjusted EBITDA increased from $78.6 million in fiscal 2021 to $719.2 million in fiscal 2025.
Free cash flow hit a record $562.4 million in fiscal 2025.
Fiscal Q4 2025 net sales were $3.26 billion, with a 5.0% adjusted EBITDA margin.
Chewy said it worked with approximately 4,000 brands and offered about 190,000 product and service offerings in fiscal 2025.
Historical customer and Autoship trend figures beginning with fiscal 2021 were presented on a recast basis in Chewy’s later investor materials.
Chewy has expanded from $8.89 billion in fiscal 2021 to $12.60 billion in fiscal 2025. Even with a tougher comparison against the extra week in fiscal 2024, the company still posted higher reported sales in fiscal 2025.
Chewy’s active customer base stayed close to 20 million for several years before climbing to 21.327 million in fiscal 2025. That suggests Chewy returned to broader customer acquisition while also keeping its core base engaged.
Net sales per active customer rose from $434 in fiscal 2021 to $591 in fiscal 2025. This metric points to higher average spending per customer across food, supplies, health products, and other recurring purchases.
Autoship became a larger part of the business over time, rising from 71.14% of sales in fiscal 2021 to 83.30% in fiscal 2025. That makes recurring subscription-like ordering one of the clearest drivers of Chewy’s revenue stability.
Gross margin improved steadily across the period, reaching 29.8% in fiscal 2025. Margin expansion helps explain why adjusted EBITDA and free cash flow have grown faster than revenue in recent years.
Adjusted EBITDA rose sharply from $78.6 million in fiscal 2021 to $719.2 million in fiscal 2025. That shows how Chewy has scaled profitability as revenue, customer spending, and Autoship penetration increased.
What these Chewy statistics show
Chewy looks increasingly like a scaled recurring-commerce platform rather than only a fast-growing online retailer. Revenue growth has remained positive, but the more notable changes have come from rising customer spend, deeper Autoship penetration, and stronger margins.
The company’s latest results also show that profitability is becoming a bigger part of the story. With record free cash flow, a larger active customer base, and more than four-fifths of sales tied to Autoship, Chewy enters fiscal 2026 with a stronger operating profile than it had several years ago.
Sources
Chewy investor relations, Fiscal Fourth Quarter and Full Year 2025 Financial Results, March 25, 2026.
Chewy investor relations, Fiscal Fourth Quarter and Full Year 2024 Financial Results, March 26, 2025.
Chewy investor relations, Fiscal Fourth Quarter and Full Year 2023 Financial Results, March 20, 2024.
Chewy investor relations, Fiscal Fourth Quarter and Full Year 2022 Financial Results, March 22, 2023.
Chewy investor relations, Fiscal Fourth Quarter and Full Year 2021 Financial Results, March 29, 2022.
Navigate the world of dog cargo barriers for SUVs to discover the perfect solution for traveling safely with your furry friend—your next adventure awaits!
Find the perfect pet weight tracking scale to ensure your furry friends stay healthy and happy—discover the top 10 options that can transform their well-being!
Get ready to discover the top 10 bird enrichment kits that will elevate your feathered friends' happiness and well-being, but which one will be their favorite?